Often it is informative to plot one set of data on top of another. While light-emitting diodes are created by combining several colors on a single chip. Although your eye sees color in discrete bands, careful selection of the composite colors can appear ‘white’.
Here the spectrum of two TT Electronics Ledium Series light emitting diodes are plotted with the CIE tristimulus curves. The tristimulus curve is a standard response of the human eye. Including tristimulus data in the plot provides context for the graph. Someone who doesn’t know much about the wavelengths of color can use the tristimulus curves to understand how the color of the LED might be perceived.
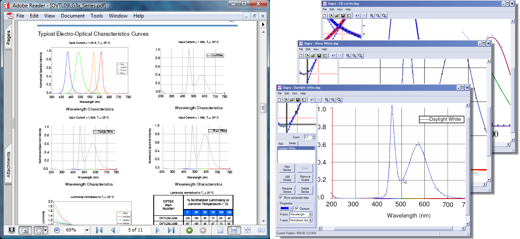
The spectral-responses of the light-emitting diodes were copied into Dagra from the product data-sheet using Dagra’s screenshot tool (File → New from Screenshot). The tristimulus curves came from Wikipedia. All were traced using Dagra then imported into Microsoft Excel.